Six questions you have to answer today.
Training, evaluation and working-time data is created where the work happens — here it lands in one view.
These do not need a report, they need an answer. There is a real query behind every one of them.
- What does someone in this role need to know?
- Where does mandatory training stall?
- What expires, and when?
- Which plant is dragging compliance down?
- Whose evaluation round is stuck?
- One specific person — where do they stand now?
Where the number comes from
-
It is created where the work happens
Training, evaluation and working-time data is created in its own module. Reporting needs no separate data entry.
-
Every module has a manager's view
The matrix and completion in training, the banking monitor in working time, the fill rate in evaluation.
-
It comes together in one place
oneDashboard brings these together. It does not copy data, and it does not ask for new data.
-
It becomes a number
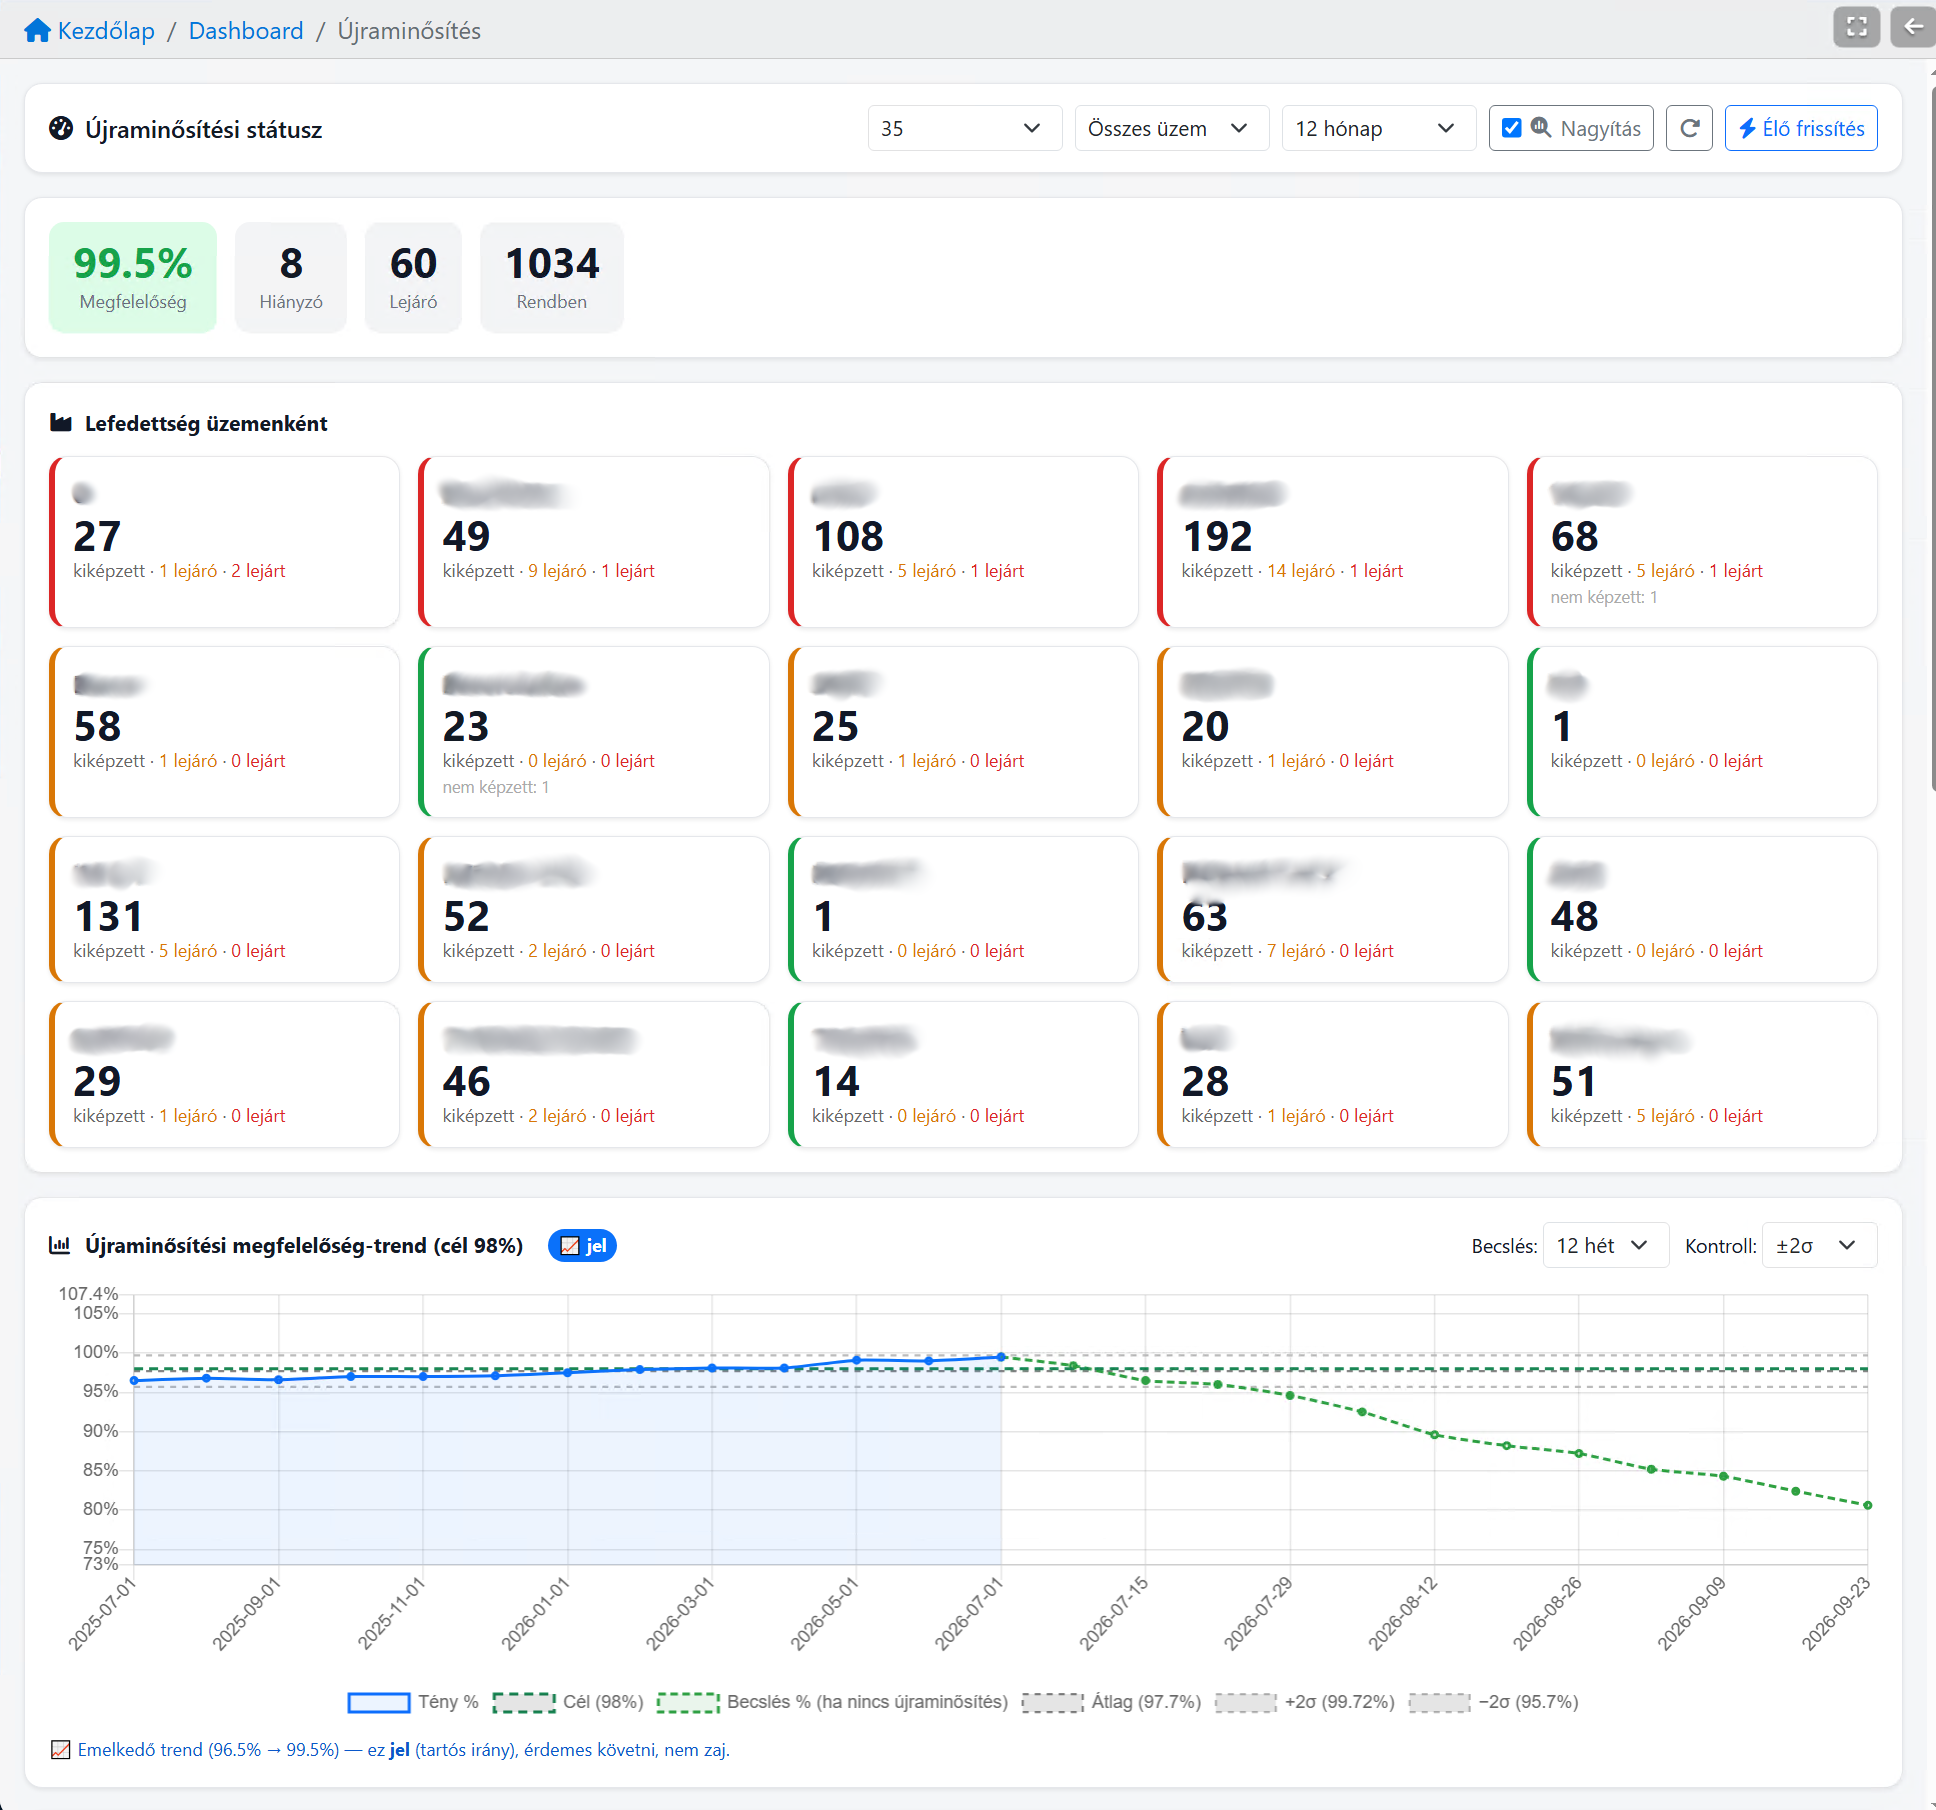
Compliance live: missing, expiring and valid training — as one figure and broken down.
-
It becomes a trend
Control limits on the trend separate signal from noise, and the forecast shows what happens if no requalification starts.
-
It becomes a decision
Pareto: where a single intervention wins you the most. Or narrowed to one person: where they stand now.
Not new data. The same data, in a form you can decide on.
What the manager sees
One location and twenty units
At a single location the question can still be answered by hand: who is covered, who is missing, what expires. A well-kept list is enough — here oneDashboard mostly saves time.
Across twenty units — production line, station, work area, however you are structured — the same question becomes a trend: what matters is not where we stand today but where we are heading, and which unit is dragging the rest down. The same queries — the comparison is what counts.
Across twenty units, this stops being a spreadsheet question.