Data on its own is not an answer.
A manager doesn't need another report. They need to see what is happening — and where to step in.
How deep shall we go?
Same system. Three depths.
Six questions you need to answer today
- Has everyone completed the mandatory training?
- What is about to expire?
- Where are the competency gaps?
- Where do the evaluations stand?
- Which unit is off track?
- What needs looking at today — not at month end?
The answers are already in the systems. They only need to come together into a picture ready for a decision.

The same data. A different angle.
-
Training
Who has completed it and who hasn't — by role and by person.
-
Expiries
What expires, and when. In date order, not on the day it expires.
-
Competencies
Where knowledge is missing: by team, by role, by person.
-
Performance
Where the evaluation rounds stand, and where results diverge.
-
Compliance
A single measure of where the organisation stands today — and what is pulling it down.
-
The management picture
All in the same view, built on the same data.
We do not produce new data. From the data you already have, we make visible what you are looking for an answer to.
Where does the number come from?
The manager sees a number. If needed, they can look behind it: by site, group, role or person.
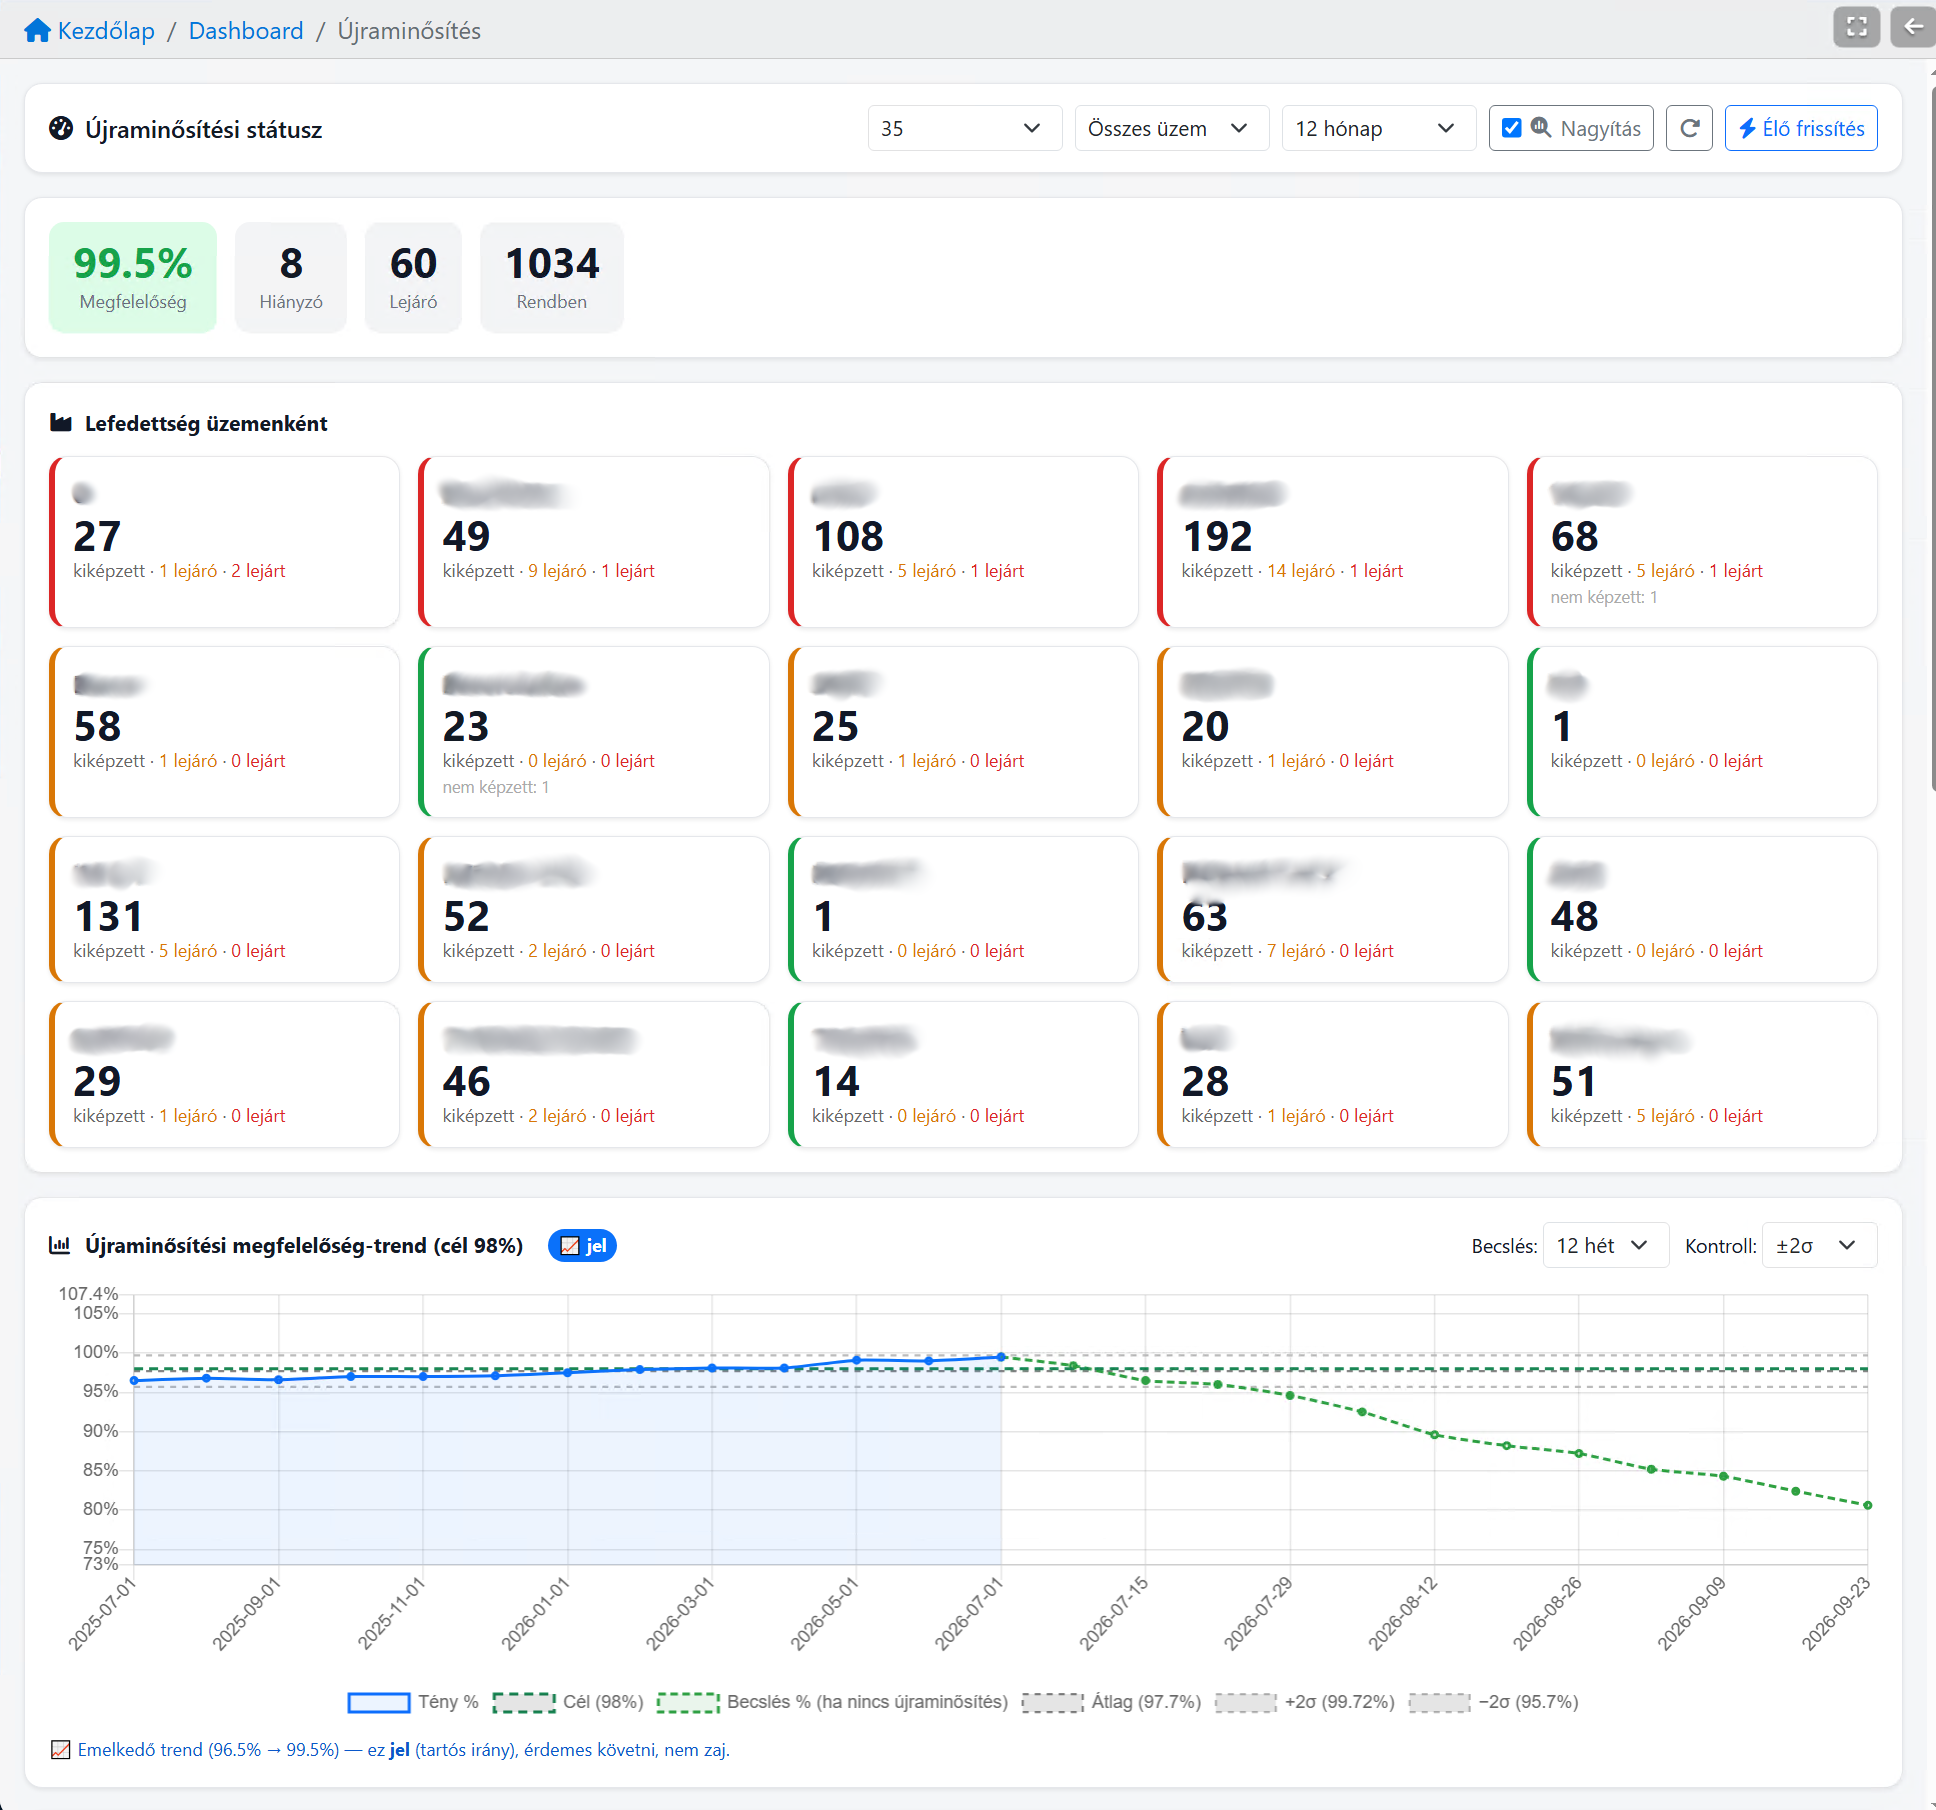
Not new data. The same data, arranged so it gives an answer.
One site and twenty units
At a single location the question can still be answered by hand: who is covered, who is missing, what expires. A well-kept list is enough — here the gain is mostly time.
Across twenty units — production line, station, work area, however you are structured — the same question becomes a trend. What matters is not where we stand today, but where we are heading, and which unit is dragging the rest down. The same queries — the comparison is what counts.
The trend of twenty units is hard to follow in a single spreadsheet.